


Live Spot Gold
Bid/Ask
4,123.104,125.10
Low/High
4,110.804,156.30
Change
-16.80-0.41%
30daychg
-253.90-5.80%
1yearchg
-127.70-3.00%
Silver Price & PGMs
(Kitco NewsWire, Tues. Oct. 20th. 2026) – Spot gold prices were lower and spot silver prices were volatile in early U.S. trading Tuesday, as weaker-than-expected housing activity highlighted the impact of elevated borrowing costs on the U.S. economy, while rising crude oil prices and persistent inflation continued to support expectations for additional Federal Reserve tightening. The latest housing figures provided some counterweight to the inflation concerns weighing on precious metals, although renewed tensions surrounding the Strait of Hormuz limited the scope for interest rate relief. In early morning trading, spot gold was near $4,120.10 an ounce, down 0.48%, while spot silver was near $57.210, up 0.42%.
U.S. housing construction weakened in September, adding to evidence that elevated mortgage rates are restraining residential investment. Housing starts fell 5.2% to a seasonally adjusted annual rate of 1.221 million units, compared with an upwardly revised 1.288 million in August. Starts were 7.4% below their year-earlier level. Single-family construction declined 4.6% to an annual rate of 859,000 units, while building permits edged down 0.2% to 1.400 million units from a revised 1.403 million in August. Single-family permits dropped 4.0% to 845,000 units. The weakness followed Monday’s decline in the NAHB housing market index to 29 from 32, its lowest reading since June 2012, as rising mortgage rates, construction costs and weakening buyer traffic weighed on builders’ confidence. The latest figures reinforce concerns that restrictive financial conditions are increasingly affecting interest rate-sensitive sectors of the economy.
Market positioning remains divided between weakening economic activity and persistent inflation pressure. September consumer prices rose 0.6% on the month and 3.7% annually, while producer prices increased 1.3% and 6.3%, respectively. The inflation surprises have left traders expecting the Federal Reserve to hold rates steady at its Oct. 27-28 meeting, with futures assigning an 82.8% probability to no change and a 17.2% probability to a 25-basis-point increase. However, markets continue to price a 93.6% probability that rates will be higher by the Dec. 9 meeting. Tuesday’s housing figures strengthen the case for leaving rates unchanged in October but are unlikely on their own to reverse expectations for December tightening while energy prices remain elevated. The benchmark 10-year Treasury yield was trading near the 5.1% area, following Monday’s rise toward 5.13%, while the dollar remained slightly softer overnight after strengthening in the previous session.
The Federal Reserve is in its premeeting communications blackout, leaving incoming economic releases as the main source of guidance on the monetary policy outlook. Tuesday’s remaining calendar includes September pending home sales at 10 a.m. EDT. Thursday brings weekly initial jobless claims at 8:30 a.m. EDT, while Friday’s preliminary October manufacturing and services purchasing managers’ indexes are scheduled for 9:45 a.m. EDT, followed by the final University of Michigan consumer sentiment reading at 10 a.m. EDT. Weaker labor-market and business activity data could reinforce concerns about slowing growth and temper expectations for additional rate increases, supporting gold through lower Treasury yields. However, persistently high inflation expectations and stronger-than-anticipated economic figures would strengthen the argument for further Fed tightening and maintain pressure on bullion.
The Strait of Hormuz and U.S.-Iran situation remains a significant source of energy-market uncertainty, with renewed attacks on commercial shipping and Saudi Arabian targets reversing some of Monday’s decline in crude oil prices. Iranian threats to shipping in the strategic waterway and renewed Houthi military activity have heightened concerns about the security of Gulf energy supplies. Oil flows through Hormuz have recovered to approximately 80% to 82% of pre-conflict volumes, but tanker movements remain disrupted and the risk of renewed interruptions continues to support an elevated geopolitical premium. Iran maintains its position that the strait should remain under its sovereign control, while negotiations with Washington over sanctions relief, maritime access and broader security arrangements have failed to produce a lasting settlement. Brent crude climbed toward $111.30 a barrel, its highest level since May, while WTI moved back above $100.00 a barrel.
For gold, the renewed escalation creates competing influences. Gulf security risks support defensive demand, but higher crude prices threaten to reinforce inflation and delay any shift toward easier U.S. monetary policy. Tuesday’s weaker housing report highlights the economic costs of elevated borrowing rates, although oil-driven inflation pressure continues to limit the bullish implications for gold. Silver faces similar monetary policy headwinds, while its industrial exposure leaves it more sensitive to deteriorating economic activity.
Global risk sentiment was mixed to weaker before the U.S. open, with technology shares remaining under pressure following renewed concerns about artificial intelligence-related spending, financing and valuations. U.S. stock index futures pointed to a softer opening, with Nasdaq futures underperforming as semiconductor and technology shares remained volatile. European equities were weaker amid persistent fiscal uncertainty in France and concerns about higher energy costs, while Asian markets posted mixed performances. Investor attention is also turning toward major U.S. corporate earnings reports, which will provide another assessment of business investment, financing conditions and the resilience of corporate profit margins in a high-interest-rate environment.
The key outside markets see Nymex WTI crude oil prices higher and trading near $100.64 a barrel, while Brent crude was near $111.30. The yield on the benchmark 10-year U.S. Treasury note is trading near the 5.1% area. The U.S. dollar index is slightly softer after Monday’s advance toward 101.97. (Kitco Global Index shows how much of today’s gold move is the dollar versus the gold market itself.)
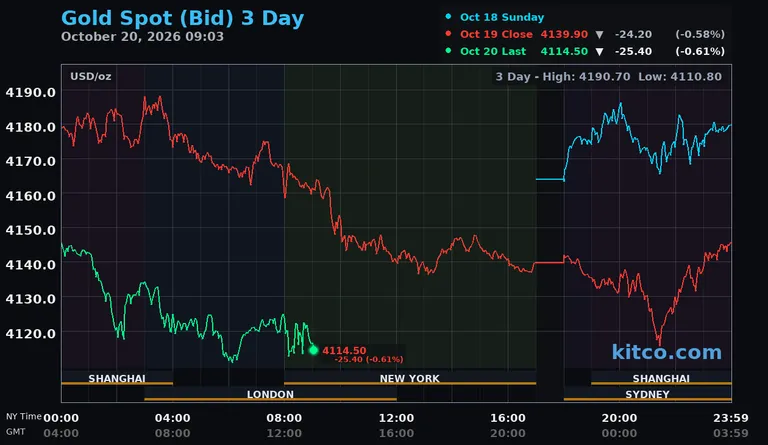
Technically, spot gold bulls’ next upside price objective is to push prices back above the $4,141.97 to $4,145.47 resistance zone, with a sustained move targeting $4,199.08 and then $4,217.40. Bears’ next near-term downside price objective is a break below $4,073.55, with deeper downside targets at $4,066.54 and then $3,942.10. First resistance is seen at $4,141.97 and then at $4,145.47. First support is seen at $4,073.55 and then at $4,066.54.
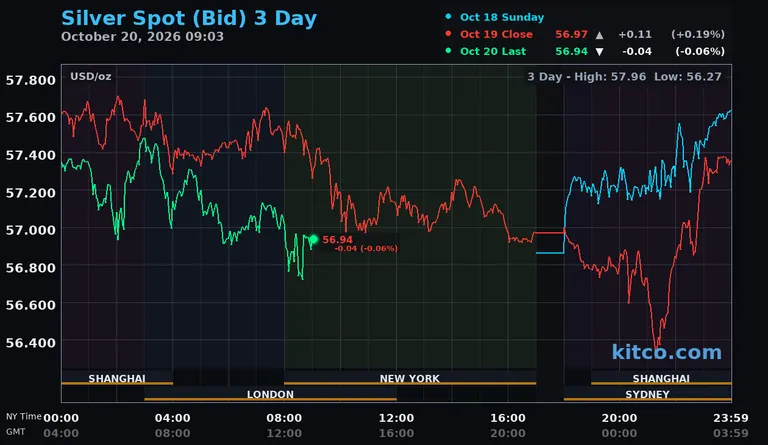
Spot silver bulls’ next upside price objective is to drive prices back above the $57.390 to $57.860 area, with a move above that zone targeting $58.700 and then $59.370. The next downside price objective for the bears is a break below $56.920, with deeper downside targets at $56.340 and then $55.400. First resistance is seen at $57.390 and then at $57.860. Next support is seen at $56.920 and then at $56.340.
Posted by:
Jack Dempsey, President
401 Gold Consultants LLC
jdemp2003@gmail.com