SPOT MARKET IS OPEN (WILL CLOSE IN 3 HRS. 15 MINS. )
Live Spot Gold
Bid/Ask
2,304.302,305.30
Low/High
2,284.402,321.00
Change
-14.70-0.63%
30daychg
+42.00+1.86%
1yearchg
+277.90+13.71%
Silver Price & PGMs
“Gold price surged over $30 an ounce after the US Federal Reserve (Fed) adopted an overall easing bias at its May policy meeting on Wednesday,” Monfort wrote. “Gold bulls bid up the price after the Fed decided to leave interest rates unchanged and to slow the pace of reduction of its US Treasury holdings, a mildly dovish move as it unwinds quantitative tightening.”
He noted, however, that the FOMC also added a hawkish phrase to their latest statement, saying “in recent months, there has been a lack of further progress toward the Committee’s 2 percent inflation objective.”
“In his prepared remarks, Powell dropped any reference to reducing interest rates this year, and sidestepped questions about whether the Fed would still be cutting rates in 2024, in the Q&A,” Monfort said. “Yet, although the overall take-away was that rates were not coming down any time soon, additional rate-hikes were not on the table either.”
Turning to the technical picture, Monfort said that spot gold “has fulfilled the minimum requirement for completing its bearish Measured Move price pattern after hitting the Fibonacci 0.681 price objective for the final C wave at $2,286.” He said this indicates that prices could be ready to move higher.

“Measured Move patterns are composed of three waves that trace out a zig-zag,” he explained. “The end of the final C wave can be estimated based on the length of wave A. It is usually either equal in length to A or a Fibonacci 0.681 ratio of A.”
In terms of direction, Monfort said the precious metal is in no-man’s land. “[A] break below the 0.681 Fibonacci target lows at $2,285 would be needed to confirm more downside to a target at $2,245 (1.000 or where A=C),” he wrote. “Alternatively, a break above the cluster of Moving Averages and the peak of wave B at around $2,350 would potentially usher in a new more bullish environment. This could then see a retest of the $2,400 highs.”
Monfort said that gold’s medium and long-term price trend is pointing higher.
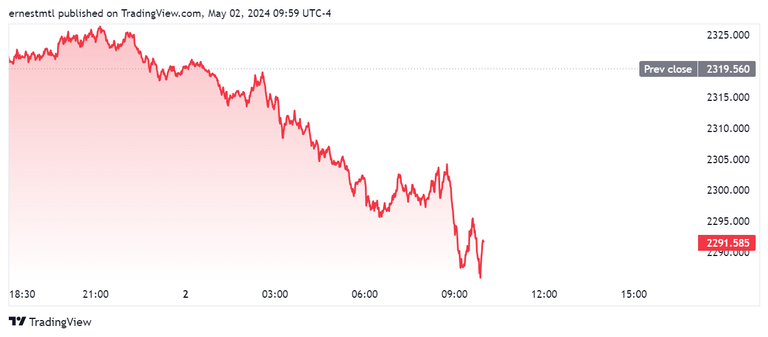
Spot gold continued to tick downward in intraday trading on Thursday, setting the session low of $2,285.54 per ounce shortly after 9:50 am EDT. It last traded at $2,291.67 at the time of writing and is down 1.20% on the session.
Posted by:
Jack Dempsey, President
401 Gold Consultants LLC
jdemp2003@gmail.com