Live Spot Gold
Bid/Ask
4,256.004,258.00
Low/High
4,244.004,304.10
Change
-30.20-0.70%
30daychg
-394.80-8.49%
1yearchg
+492.90+13.10%
Silver Price & PGMs
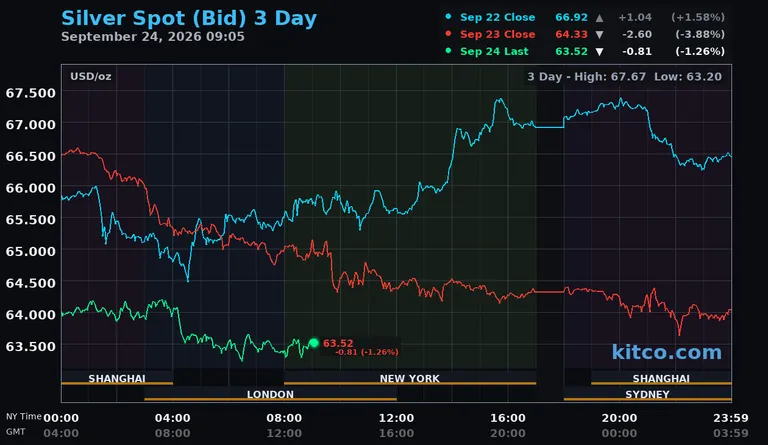
(Kitco NewsWire, Thurs. Sep. 24th, 2026) – Spot gold prices were modestly lower and spot silver prices were under heavier pressure in early U.S. trading Thursday, as rising oil prices, elevated Treasury yields and firmer Fed rate-hike expectations offset safe-haven demand tied to the U.S.-Iran conflict. At the time of writing, spot gold was trading near $4,265.30 an ounce, down 0.48% on the session, while spot silver was trading near $63.470, down 1.34%.
Market positioning hardened after Wednesday’s September flash PMI release showed the strongest U.S. private-sector growth in more than five years, with input-cost pressure intensifying as energy costs rose. Thursday’s weekly jobless claims then fell to 197,000, below expectations near 204,000, keeping the labor-market baseline firm enough to support hawkish Fed pricing. Rate futures now imply roughly a 70% chance of another 25-basis-point increase in October, while the dollar index is holding near 101.05 and the 10-year Treasury yield is trading near the 5.1% area. New-home sales are due at 10:00 a.m. ET Thursday, followed by August durable goods orders at 8:30 a.m. ET Friday and final September consumer sentiment at 10:00 a.m. ET Friday. Stronger housing, orders or inflation-expectations data would keep pressure on gold through yields and the dollar; softer readings would test whether the latest metals selloff has over-discounted the Fed path.
The Strait of Hormuz risk premium is back in crude after U.S.-Iran talks showed little sign of progress. Iran is reviewing Washington’s response to proposals that prioritize lifting the U.S. naval blockade on Iranian ports and reopening the Strait of Hormuz, while Iranian security officials have said the strait will not reopen until Tehran’s conditions are met. Brent crude traded near $104.71 a barrel, while WTI was near $93.53, with the rebound in oil adding to the inflation impulse that is pushing yields higher. Gold is still receiving geopolitical support, but the current market transmission is running mainly through oil, inflation expectations, Treasuries and the dollar.
The key outside markets see Nymex WTI crude oil prices higher and trading near $93.53 a barrel, while Brent crude was near $104.71. The yield on the benchmark 10-year U.S. Treasury note is trading near the 5.1% area. The U.S. dollar index is holding near a two-month high. (Kitco Global Index shows how much of today’s gold move is the dollar versus the gold market itself.)
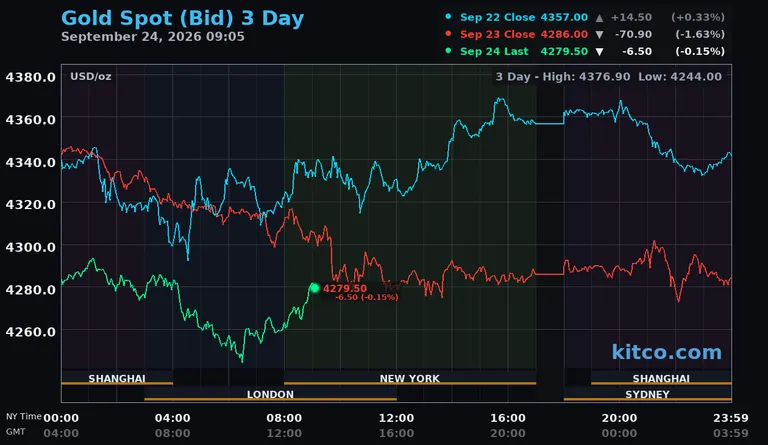
Technically, spot gold bulls’ next upside price objective is to push prices back above the $4,312.07 to $4,319.60 resistance zone, with a sustained move targeting $4,347.26 and then $4,399.67. Bears’ next near-term downside price objective is a break below $4,235.17, with deeper downside targets at $4,230.51 and then $3,996.06. First resistance is seen at $4,312.07 and then at $4,319.60. First support is seen at $4,235.17 and then at $4,230.51.