SPOT MARKET IS OPEN (WILL CLOSE IN 2 HRS. 36 MINS. )
Live Spot Gold
Bid/Ask
2,357.202,358.20
Low/High
2,349.502,362.20
Change
+1.40+0.06%
30daychg
+31.20+1.34%
1yearchg
+433.50+22.53%
Silver Price & PGMs

(401 G. C. /Kitco Wednesday, July 3rd, 2024) – As the short trading week progresses, gold traders are trying their best to make sense of the most important piece of economic data that impacts the shining metal’s main denominator—the price of the dollar index. The Fed’s monetary policy largely determines the greenback’s price, and the release of the Fed’s minutes later in the day could help clarify the Fed’s next monetary policy amid a murky labour market picture.
The US labour market continues to confuse gold traders.
Today, the shinning metal’s price has been trading to the upside, especially before the economic numbers were released. The reason for the upside move in the gold price was mainly the comments released by the Fed Chairman, who was sharing the stage with other central bankers, such as the President of the European Central Bank, Christine Lagarde. Jerome Powell, the Chairman of the Federal Reserve, indicated to the market participants that there is less resistance for the Fed to act in the way they are anticipating, which is an interest rate cut this year. According to market bets, there is a 60% chance that the Fed will lower its interest rate in September, and market players anticipate another rate cut in December this year. In terms of the magnitude of the interest rate cuts, we think that the Fed will take a more systematic approach, bringing the interest rate lower by 25 basis points during September and another rate cut by the same magnitude by the end of this year.
What is more important to note is that the Fed’s interest rate cut decision is very much dependent on the inflation situation, which has started to move in the direction that the Fed wants it to move, and by September we will have a more clear picture of the inflation situation. Hopefully, this month’s and the month after’s readings will bring a more positive outlook for inflation and make things less confusing for investors and traders in relation to the interest rate equation.
What is highly confusing for market players is reading the US job market numbers and assessing the actual picture of the labour market. For instance, yesterday we had the US JOLTS data, which for the first time in nearly two months produced a more positive outlook for the market. However, if we focus on today’s labour market number, the situation becomes highly confusing. Jobless claims, for example, rose; continuing claims reached their highest level since November 2021. The private payrolls number, the US ADP, increased only by 150K, missing the forecast and producing the lowest number since January. The leisure and hospitality numbers supported most of the jobs in the ADP. While this may not be good news for the Fed, it is a positive development for gold traders, as it increases the pressure on the Fed to take action before the situation worsens.
One good thing that today’s labour brought for the Fed and for gold traders is the wage growth number, which showed that it has slowed to 4.9%. If wage growth isn’t increasing at a
rapid pace, inflation isn’t likely to spiral upward, and if price inflation remains under control, there are higher odds for the Fed to cut the interest rate. All this would hurt the dollar index and boost gold.
The Disastorous PMI Numbers and Gold Price
Today, gold bulls can confidently assert that anyone doubting the direction of the gold price and the trajectory of the US economy need only examine the US ISM Manufacturing PMI. The number was disastrous, as the PMI manufacturing data confirmed that it is in contraction territory. The actual number came in at 48.5, while the forecast was for 49.2. The previous reading was 48.7.
Simply put, the data has now increased the odds of an interest rate cut in September even further.
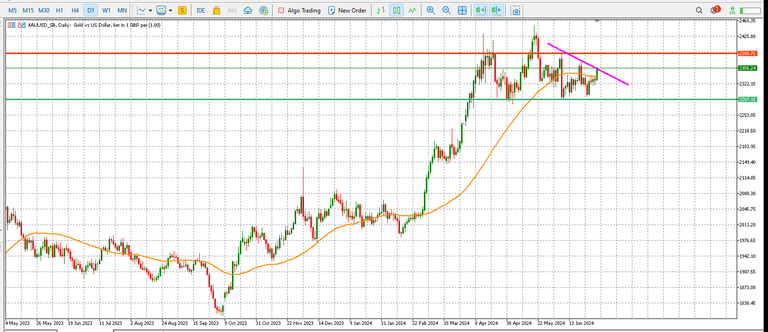
Important price levels to watch for gold
In terms of technical price analysis, the gold price is certainly showing a lot of strength for two reasons. Firstly, the price has moved above the 50-day SMA on the daily time frame, which confirms that the bulls are back in the driving seat. Secondly, the price is challenging the downward trend line, and it appears that it is more than likely to move above this line—another bullish signal. Having said all of this, if we zoom out, the price is still very much trading in a range base, which is running between 2287 and 2388. The chart shows the key resistance levels, with the red line representing resistance and the green line representing support.
Posted by:
Jack Dempsey, President
401 Gold Consultants LLC
jdemp2003@gmail.com