Live Spot Gold
(Kitco, Thurs. Oct. 17th, 2019) – Gold and silver prices are slightly higher in early U.S. trading Thursday. A batch of U.S. economic data just released was a mixed bag but leaned just a bit on the weak side, which gave the gold market a slight lift. December gold futures were last up $1.00 an ounce at 1,495.00. December Comex silver prices were last up $0.148 at $17.585 an ounce.
Asian and European stock markets were mostly up overnight. The U.S. stock indexes are pointed toward higher openings when the New York day session begins. Risk appetite among traders and investors is a bit more robust Thursday on reports the U.K. and the European Union have reached a deal for the U.K. to leave the EU (Brexit) under good conditions. The deal needs to be ratified by both governments’ parliaments, however.
The Brexit news is making for a strong rally in the British pound, which has hit a four-month high. The Brexit news also put some overnight pressure on safe-haven assets like gold.
Nymex crude oil prices are slightly lower and trading around $53.00 a barrel today. The other key “outside market” sees the U.S. dollar index lower and hitting a six-week low overnight. The greenback is fading, due in part to some downbeat U.S. retail sales data released Wednesday that ups the odds of a Federal Reserve interest rate cut coming yet this year.
U.S. economic data due for release Thursday includes the weekly jobless claims report, the Philadelphia Fed business survey, new residential construction, industrial production and capacity utilization and the weekly DOE liquid energy stocks report.
How Far Can The Stock Market Run?
Hey Very little to the upside. Very much to the downside.
Macro Valuation Metrics
( Global Macro Monitor, Thurs. Oct. 17th, 2019) – Lots of incoming over our S&P Shooting Star post, most of which can mostly be summed up to the effect, “Why so bearish?”
Seriously? Our predisposition to the market is always anchored in time tested valuation metrics, which are hard to manipulate. That is why we like market capitalization deflated by some macro variables, such as nominal GDP or wages.
Micro measures, such as Price-to-Earnings are way too distorted by buybacks and can be easily manipulated by CFOs, who play around with variables such as depreciation or loss reserves.
Our two favorite are 1) market cap-to-GDP, which, according to Warren Buffet is, “the best single measure of where valuations stand at any given moment.” Take a look at the following chart and you will understand why the Oracle of Omaha is sitting on a record $122 billion stockpile of cash, 2) the number of hours of work needed to buy the S&P500, not a perfect valuation measure but does track our other favorite quite well. The average person, making the average salary is not a big holder of stocks but the metric does give a heads up when the stock market becomes divorced from the underlying economic trend.
Take a look at the data and you decide, folks. Keep in mind, the charts are ratios, not price indices, and can’t continue to rise from lower left to upper right, forever.
Turn off the talking heads on bubble vision and #FinTwit, who will find it difficult to interpret the following charts because their salaries and year-end bonuses depend on their not understanding them or are incentivized to dismiss them outright.
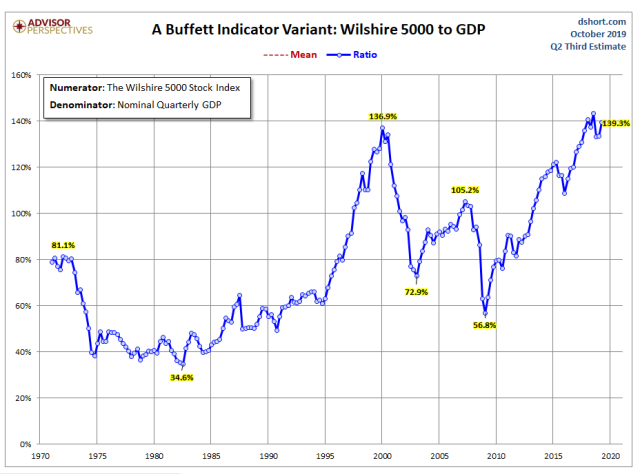 Source: Advisor Perspectives
Posted by :
Jack Dempsey, President
401 Gold Consultants LLC
jdemp2003@gmail.com